Zabbix is an open-source and enterprise-level monitoring solution designed to track the performance and availability of your servers and apps. Zabbix offers a comprehensive set of features, including multi-dimensional monitoring, scalability, and robust automation. It also provides customizable alerts and notifications, insightful visualizations, and strong security. Zabbix is cost-effective and integrates seamlessly with most APIs and third-party tools.
Here is a step by step guide to set up Zabbix on a Kamatera cloud server.
Create an account on Kamatera
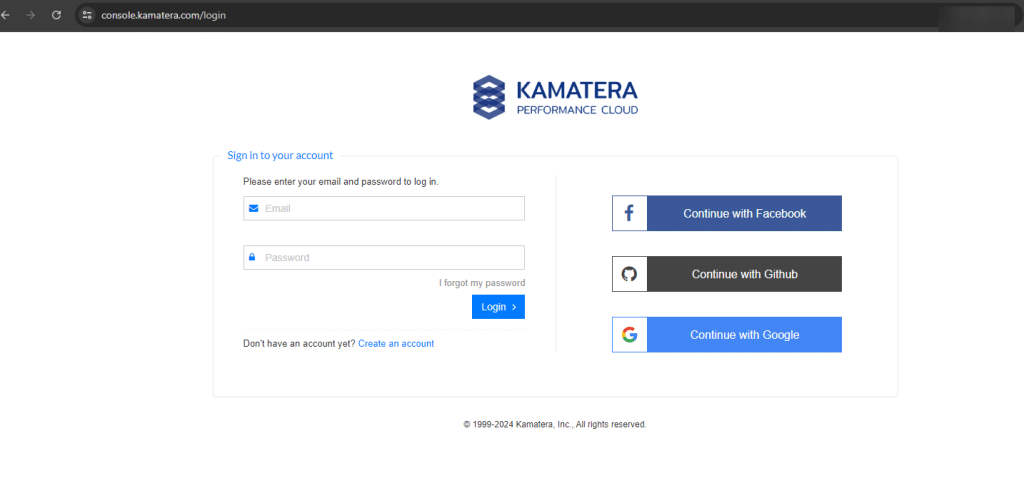
- Enter your credentials to access the Kamatera management console. Click Login.
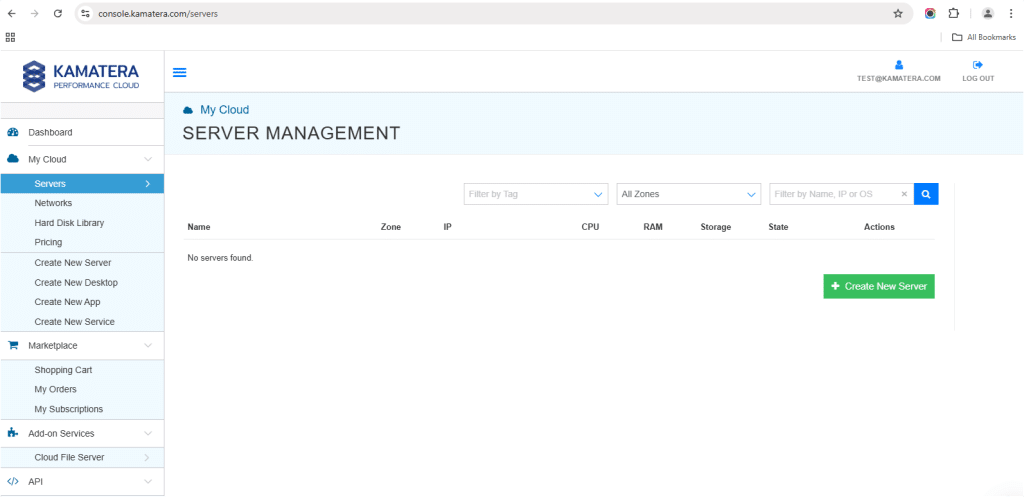
2. Navigate to My Cloud on the left hand side. Select Servers.
From the left-side navigation menu, click on Create New Server or use the Create New Server option on the right-hand side.
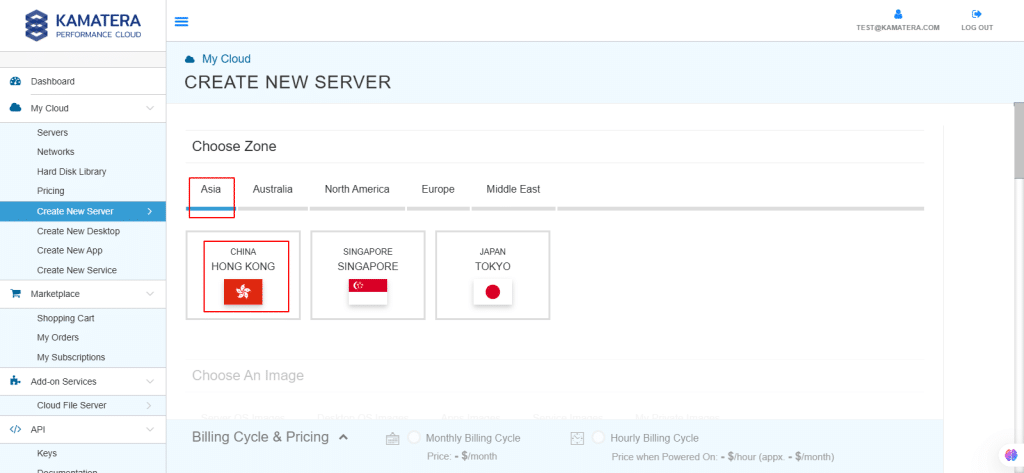
3. Choose the zone from the following options:
- Asia
- Australia
- North America
- Europe
- Middle East
Depending on the zone you select, the available countries will be displayed.
For this example, we chose the Asia server domain to set up the Ubuntu server.
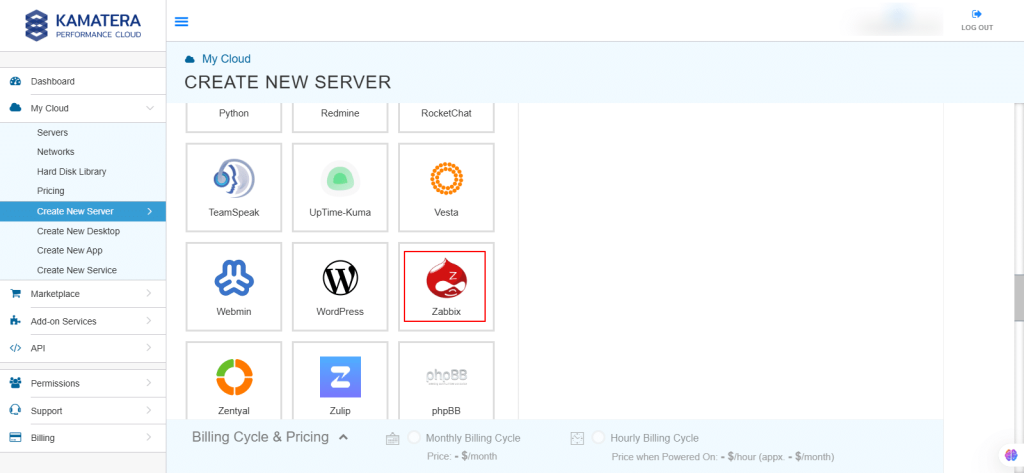
4. Kamatera offers a variety of apps and server images to help users set up preconfigured resources. Users can explore the following options:
- Server OS images
- Desktop OS images
- App images
- Service images
- My private images
Choose Apps Images and select Zabbix.
5. In Choose Version, select the latest version of Zabbix.
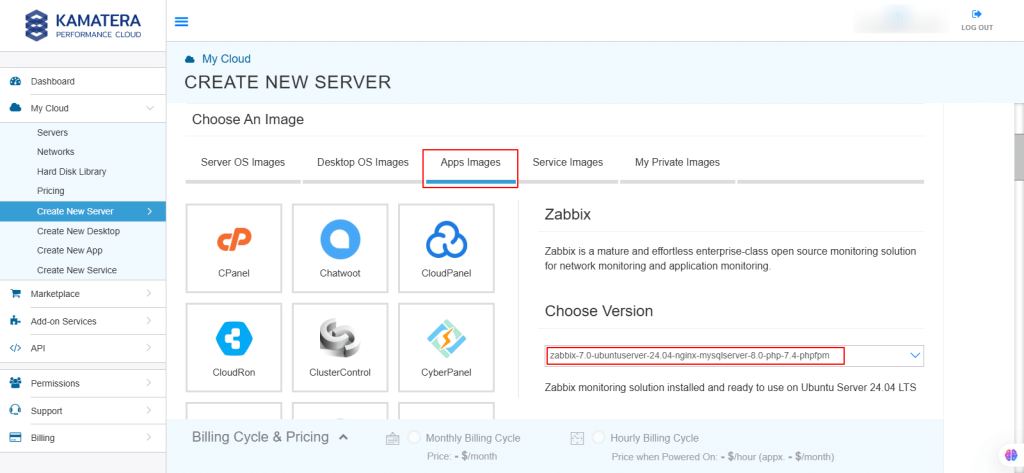
6. Upon selecting the version, toggle the Detailed view button to ‘on’ to view the detailed description, including the price.
Choose Server Specs.
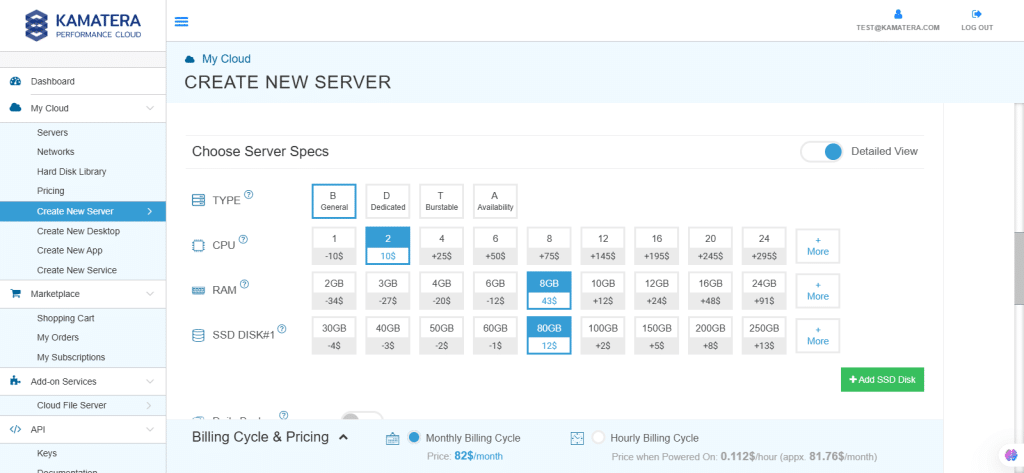
| Field | Description |
| Type | Type B-General Purpose: Server CPU are assigned to a dedicated physical CPU thread with reserved resources guaranteed.
Type D–Dedicated: Server CPU are assigned to a dedicated physical CPU Core (2 threads) with reserved resources guaranteed. Type T-Burst: Server CPU are assigned to a dedicated physical CPU thread with reserved resources guaranteed. Exceeding an average usage of 10% will be extra charged for CPUs usage consumption. Type A-Availability: Server CPUs are assigned to a non-dedicated physical CPU thread with no resources guaranteed. Note: More information on CPU types is available on the My Cloud Pricing page. |
| CPU | Choose the number of vCPUs that will be installed on the server. Type B/T can be configured with up to 104 vCPUs per server. Based on Intel’s latest Xeon Processors, 2.7 GHz+. |
| RAM | Choose the amount of RAM that will be installed on the server. Type B/T/D can be configured with up to 512GB RAM per server. |
| SSD DISK | Choose SSD Storage Size. You can add up to 15 SSD Disk. SSD Storage includes unlimited IOPS and unlimited storage bandwidth, free of charge. |
| Daily Backup | Toggle the switch to enable extended daily backups of your server’s storage to external backup storage. |
| Management Services | Toggle the switch to enable Management Services to the server’s operating system by the echnical support team. |
7. Choose networking. Users can select the network they wish to use, whether it’s a public internet network or a private local network.
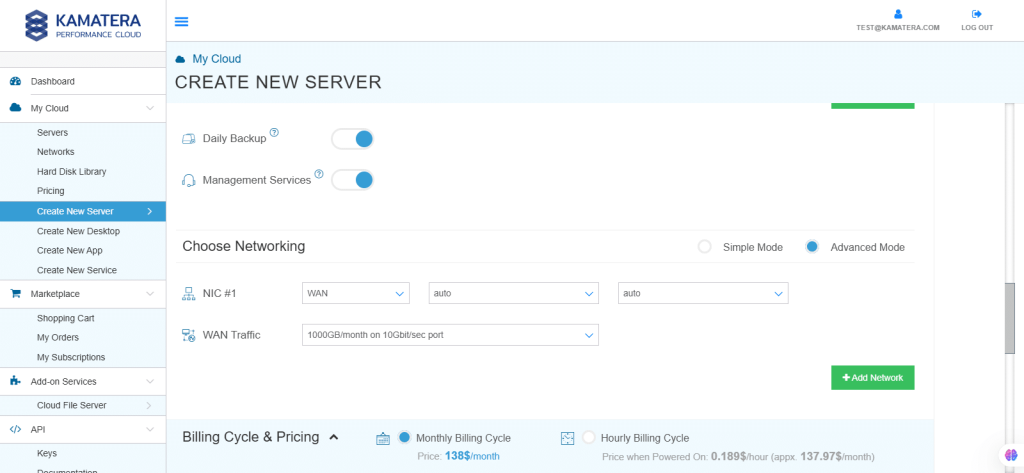
| Field | Description |
| Public Internet Network | Check to connect the server to a network interface connected to Public Internet Network. |
| Private Local Network | Check to connect the server to a network interface connected to Private Local Network. |
8. Advanced mode

| Field | Description |
| NIC #1 | Select WAN from the options available in the drop-down menu.
Select auto from the options available in the drop-down menu.
Select auto from the options available in the drop-down menu.
|
| WAN Traffic | Select 5000 GB per month on 10 Gbit per second port. |
9. Advanced Configuration
Hide: If you want to hide the advanced configuration
Show: If you want to see the advanced configuration
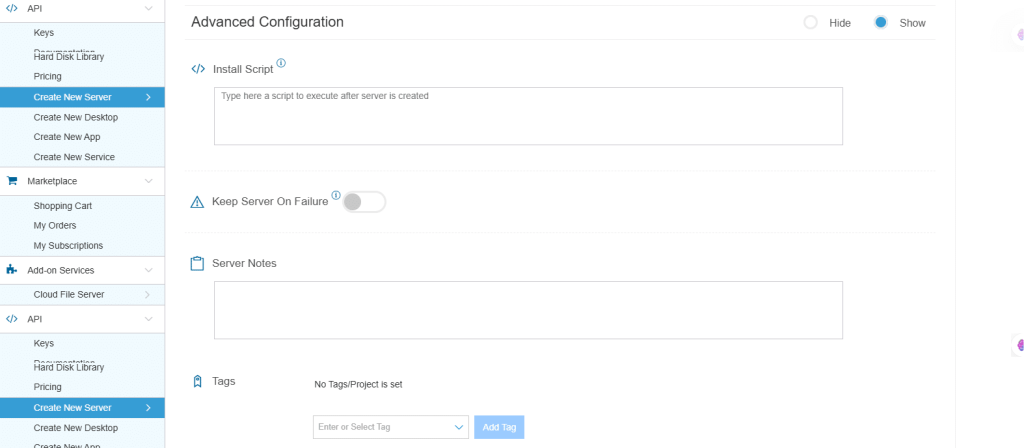
| Field | Description |
| Install Script | Enter the script here to execute, once the server is created.
Note: For Windows system, use Power Shell. |
| Keep Server On Failure | Do not terminate server if start-up script or provisioning fails |
| Server Notes | Enter any server notes. |
| Tags | Select the tags from the drop-down menu and click Add. |
10. Finalize Settings
Finalize settings by setting the password, re-validating it, selecting the number of servers, specifying the server name, and enabling the Power On Servers option.
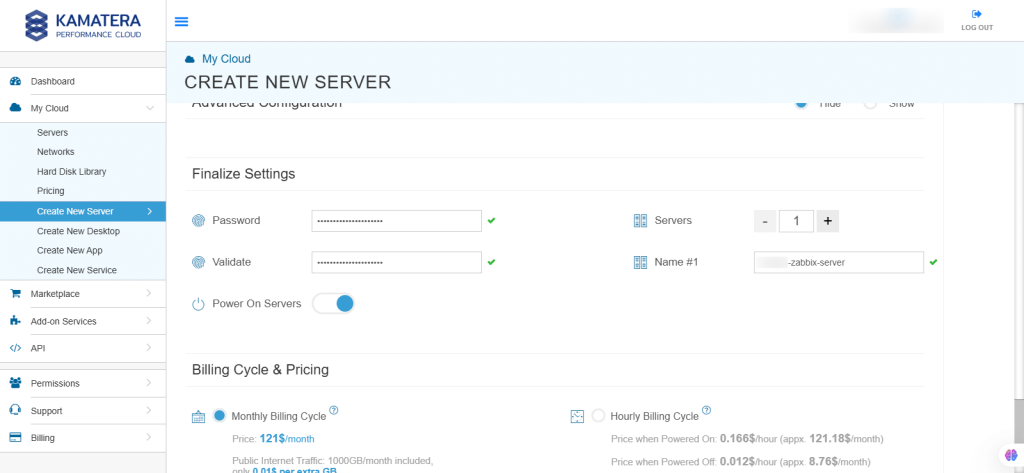
| Field | Description |
| Password | Select password
Password allowed characters: a-z, A-Z,0-9 !@#$^&*()~ and must need the following requirements:
|
| Validate | Re-enter the password to validate |
| Servers | Select the number of servers the user wants |
| Name # 1 | Enter the name of the server |
| Power On Servers | Switch on the toggle button to see the details |
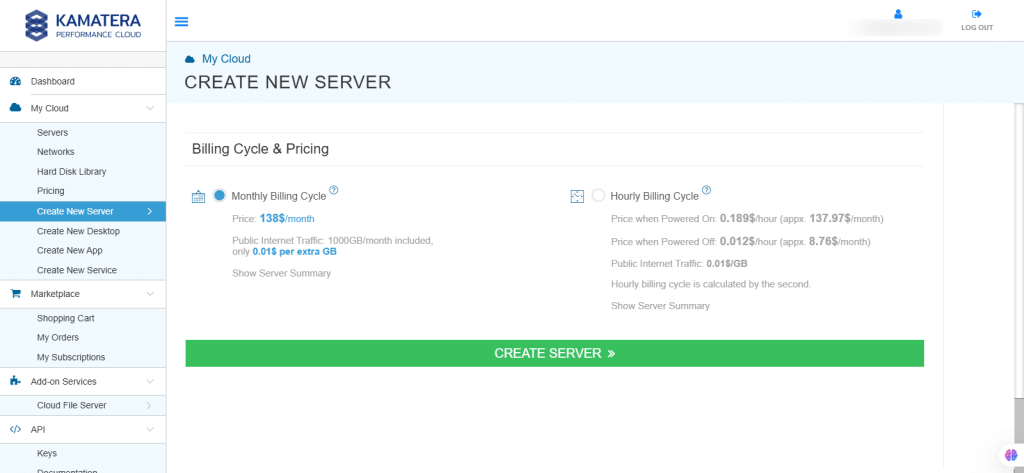
11. Billing Cycle and Pricing
You can choose between the Monthly Billing Cycle and Hourly Billing Cycle.
Note: The Server Summary displays the location, operating system (including server specifications), add-on services, servers, and pricing.
Click Create Server.
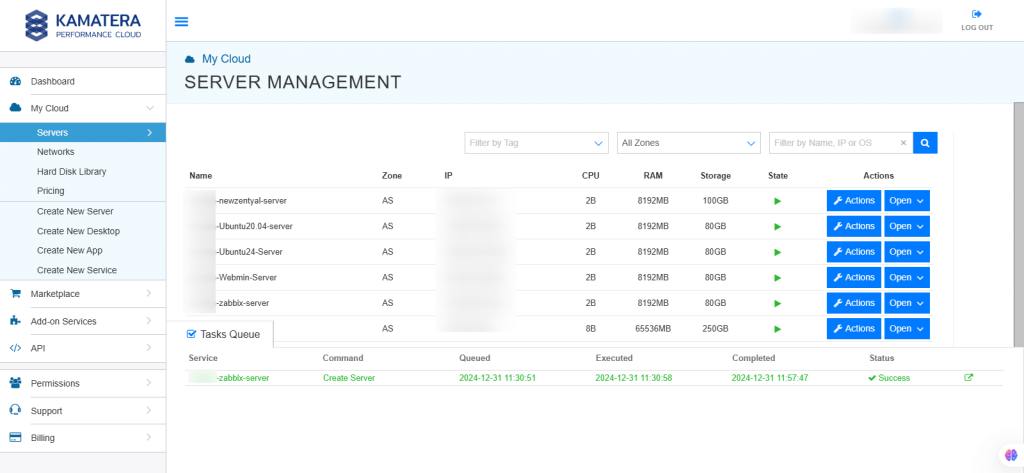
12. The server is added to the Tasks Queue. Once the server is created successfully, click on Open beside the server’s name.
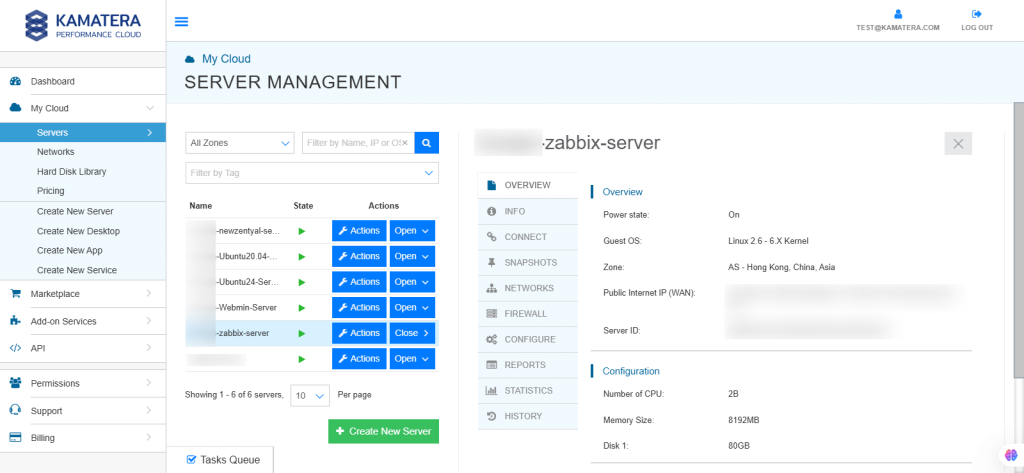
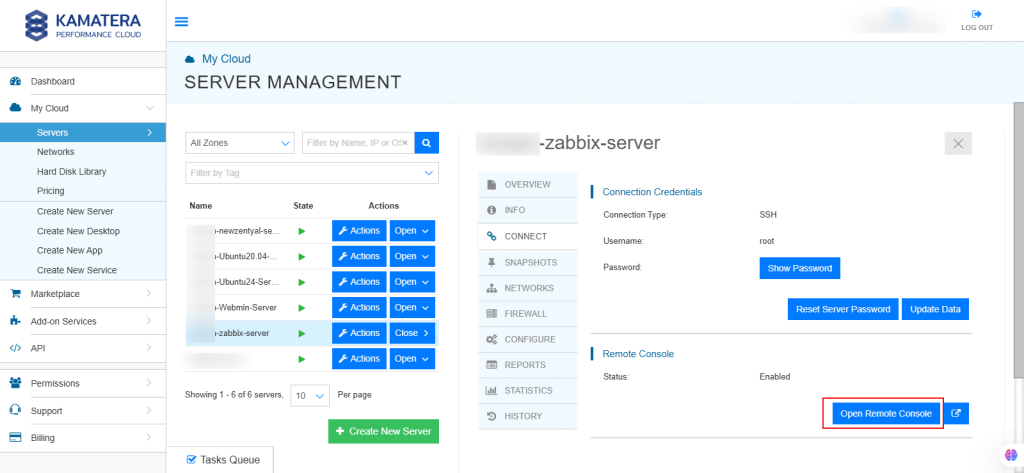
13. On the right, the overview of the server is displayed. Click on Connect.
Configure Zabbix
14. Connection credentials like Username and Password are displayed. Under Remote Console, click Open Remote Console.
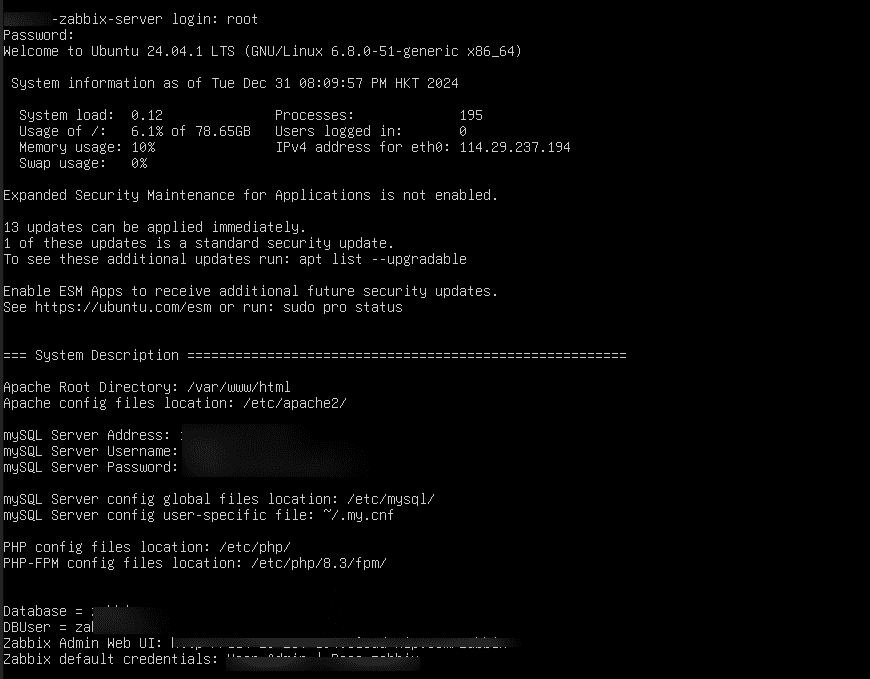
15. You will be redirected to the terminal. Enter your login credentials which you set up during the Zabbix server installation.
Once logged in, you will see mySQL Server Address, Username, Password, Database, DBUser, Zabbix Admin Web UI, and Zabbix default credentials.
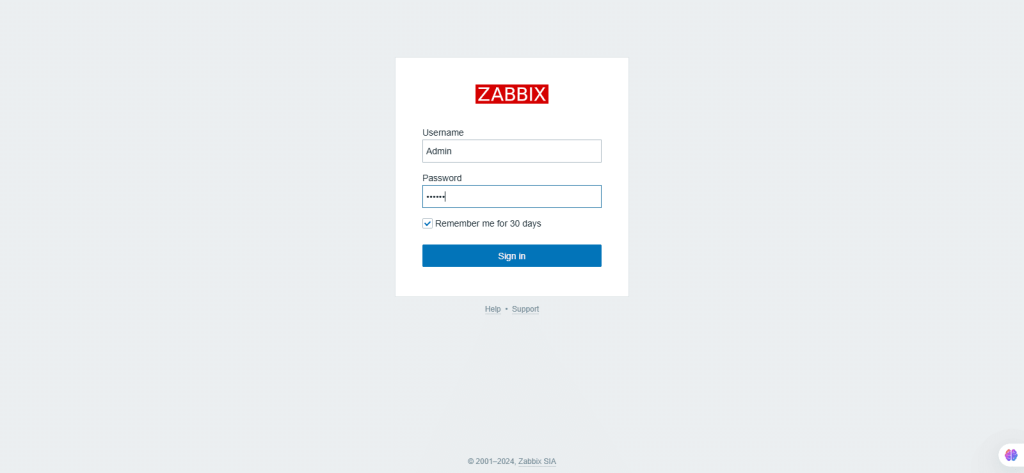
16. Navigate to the browser and enter the Zabbix Admin Web UI given in the previous image (i.e., the image in step 15), you will see the Zabbix login screen. After entering your Username and Password, click Sign In.
17. After login, you will see the dashboard. On the top-right corner of the page, click Edit dashboard.
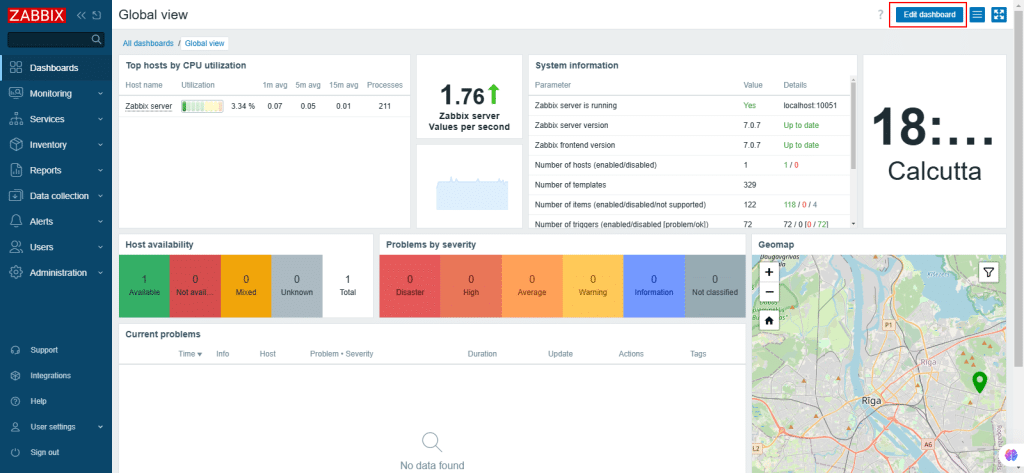
18. You can add widgets and pages on the dashboard. Once changes are updated, click Save changes.
Click Cancel if you do not want to make changes.
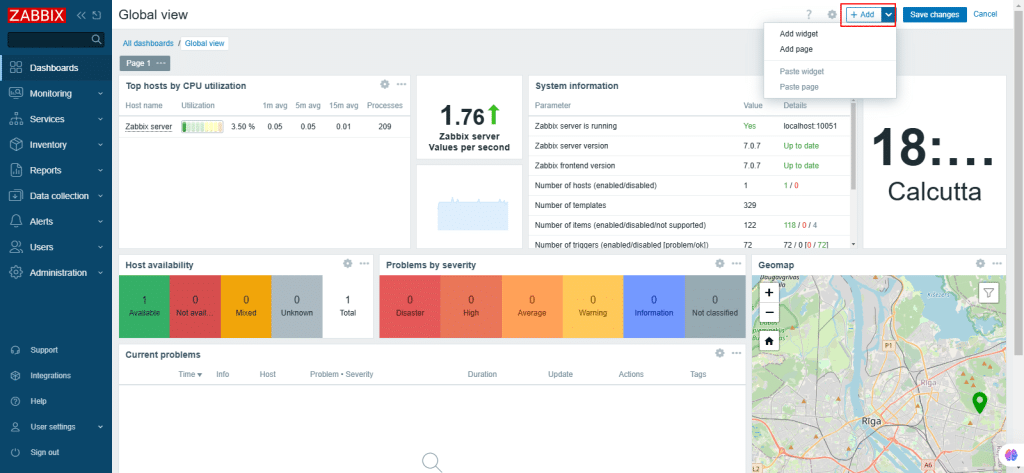
19. Navigate to the top-right corner of the page, click on 3 horizontal lines and the ACTIONS drop-down menu shows up. You can share, create new, clone, delete and create new reports by using these options.

20. From the left navigation menu, select Monitoring.
Deciphering problems in Zabbix
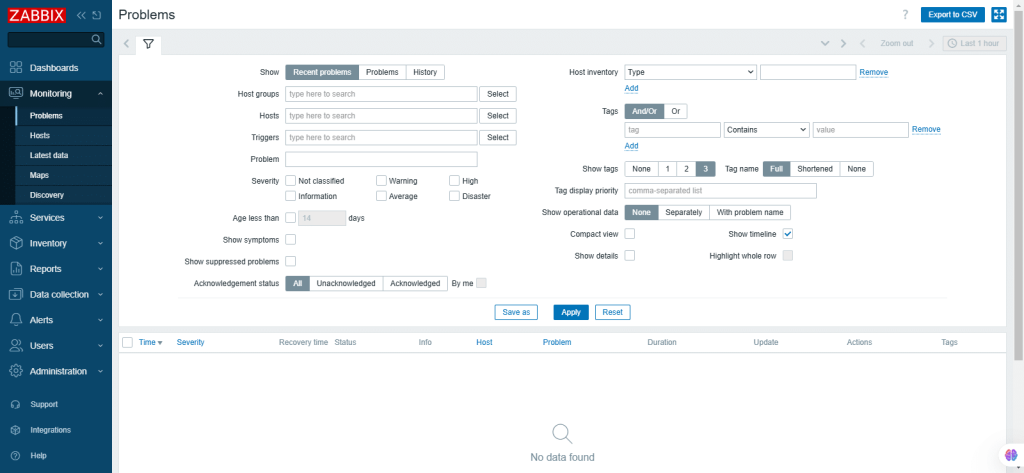
A new page opens showing the current problems. Problems are those triggers that are in the Problem state.
- Operational data display: It can be configured by selecting None, Separately, or With Problem Name.
- None: No operational data is displayed.
- Separately: Operational data is displayed in a separate column.
- With Problem Name: Operational data is appended to the problem name and is mentioned in parentheses.
- Export to CSV: By clicking on this, it exports content from all pages to a CSV file.
- Using filter: Filter can be used to display all the problems which you are interested in.
- Apply: Apply specified filing criteria.
- Reset: Reset current filter and return to saved parameters of the current tab.
- Save as: Save as current filter.
- Update: Replace tab parameters with currently specified parameters.
21. Hosts
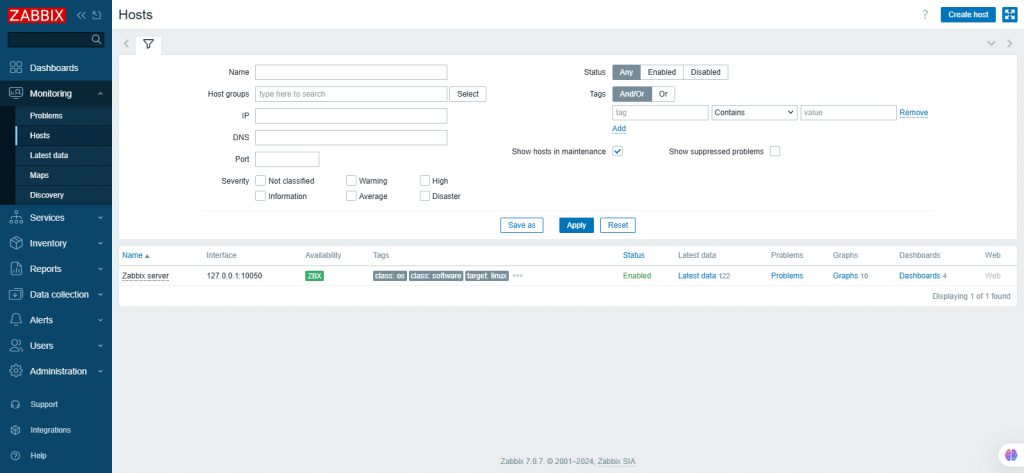
A host in Zabbix is a networked entity that you wish to monitor. It can be a physical server, a network switch, a virtual machine or some application.
It displays a full list of monitored hosts with detailed information about the host interface, availability, tags, current problems, status.
Enter the mandatory fields. Click Apply to create a new host.
22. Latest data
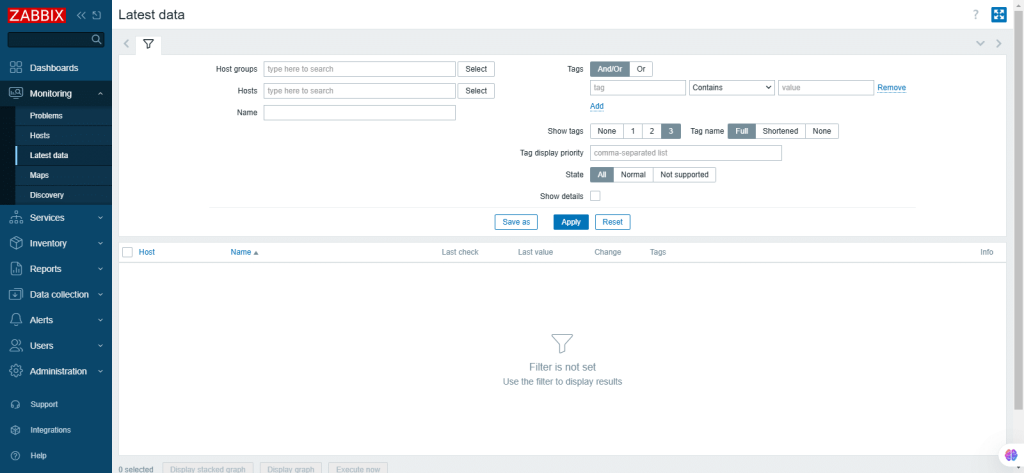
The Latest Data page in the Zabbix user interface gives an overall view of the most recent monitoring data collected from the configured hosts and their items. This page is essential for reviewing real-time performance metrics and diagnosing issues.
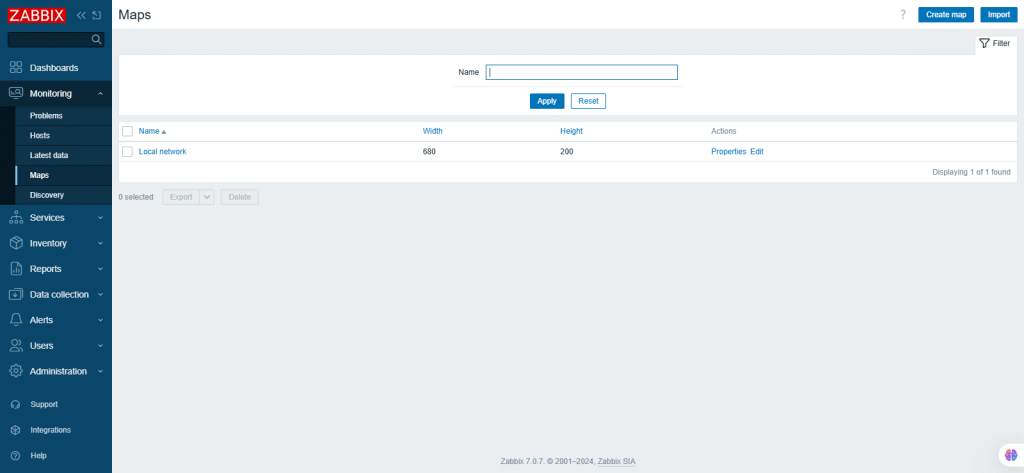
23. Maps
In Zabbix User Interface, the Maps section provides a visual representation of your IT infrastructure. Here, you can configure, manage and view network maps.
24. Discovery
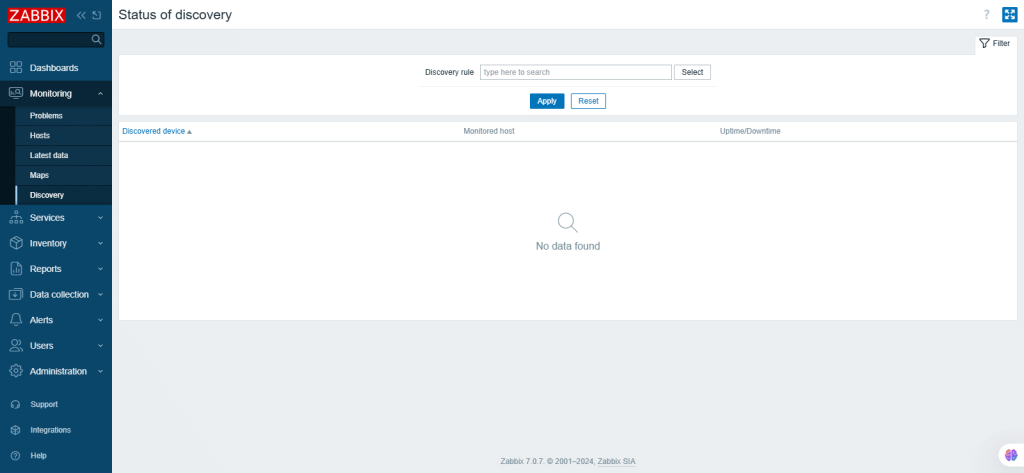
The Discovery section automates the detection of network devices and services.
Discovered devices are organized according to the discovery rule.
To configure a network discovery rule to discover hosts and services, click on Create discovery rule to edit the discovery rule attributes.
25. From the left-navigation menu, select Services.
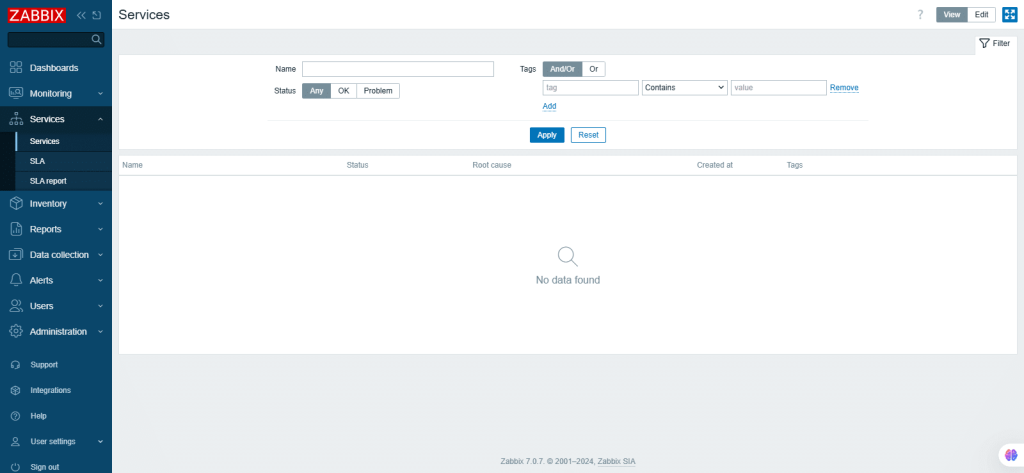
In Zabbix User Interface, the Service monitoring section provides a business-level overview of your IT infrastructure, focusing on the high-level status of the overall availability and performance of services.
Performing Services
To create a new service, navigate to the upper-right corner and switch from View mode to Edit mode.
To add a child service, click on plus icon next to the parent service.
Enter the mandatory fields and click Update.
Service tags: The Service tags are used to match services with service actions and SLAs.
Problem tags: The Problem tags are used to match problems and services. These tags are specified at the primary service configuration tab.
26. SLA
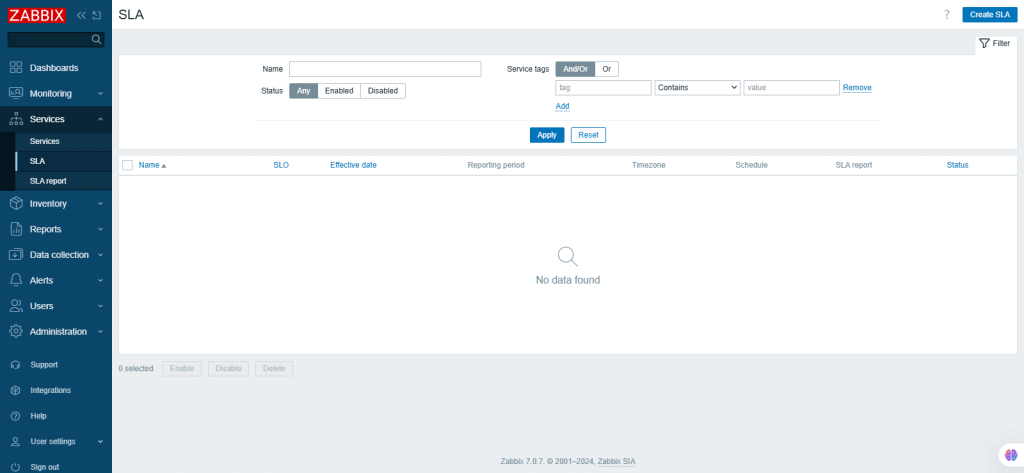
Once all the services are created, you can monitor the performance that is on track with Service Level Agreement (SLA).
To create a new SLA, click Create SLA on the upper-right corner of the page.
Once the necessary fields are entered click Add.
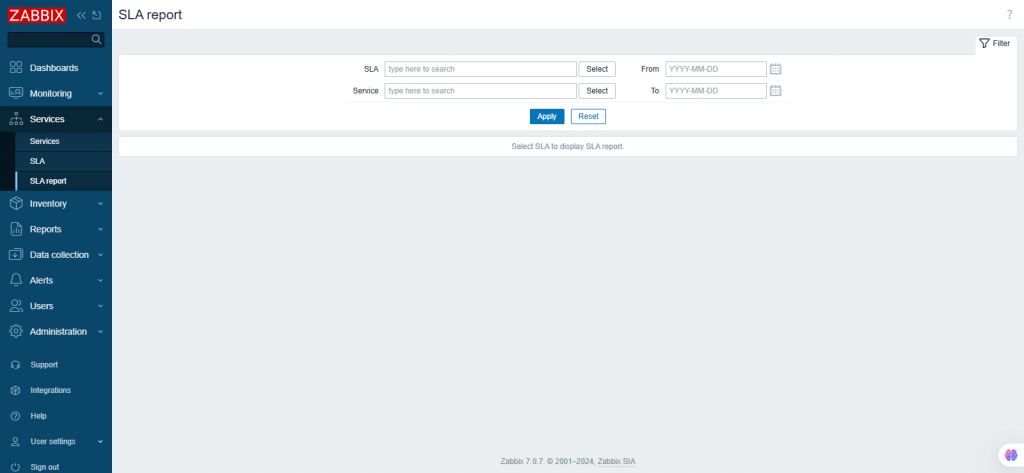
27. SLA report
SLA report shows how a service is performed compared to SLA. SLA reports can be displayed as a dashboard widget.
28. From the left-navigation menu, select Inventory.
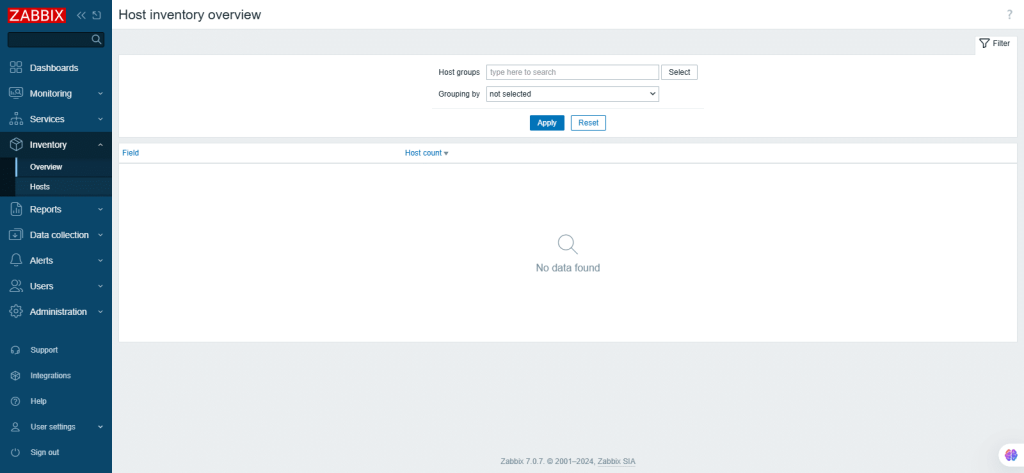
The Inventory section enables you to view host inventory data based on selected parameters and access detailed inventory information for each host.
Overview
Select Host groups and the inventory field by which you want to display the data. The number of hosts corresponding to each field will be displayed on the screen.
29. Host inventory
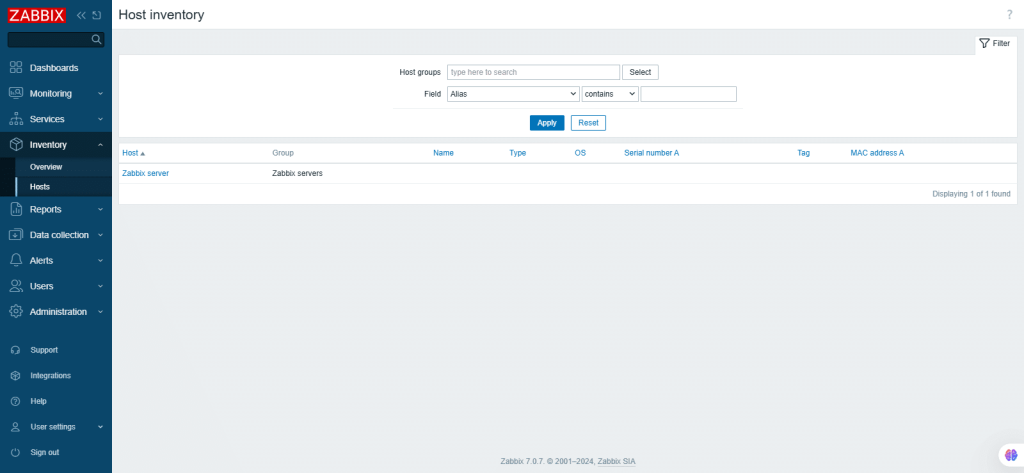
In the Host inventory section, you can filter hosts by host groups and any inventory field to display only the relevant hosts.
If you want to view all host inventories, leave the host group filter empty, clear the comparison field, and click Filter.
For complete inventory details, click the hostname in the first column.
30. From the left-navigation menu, select Reports.
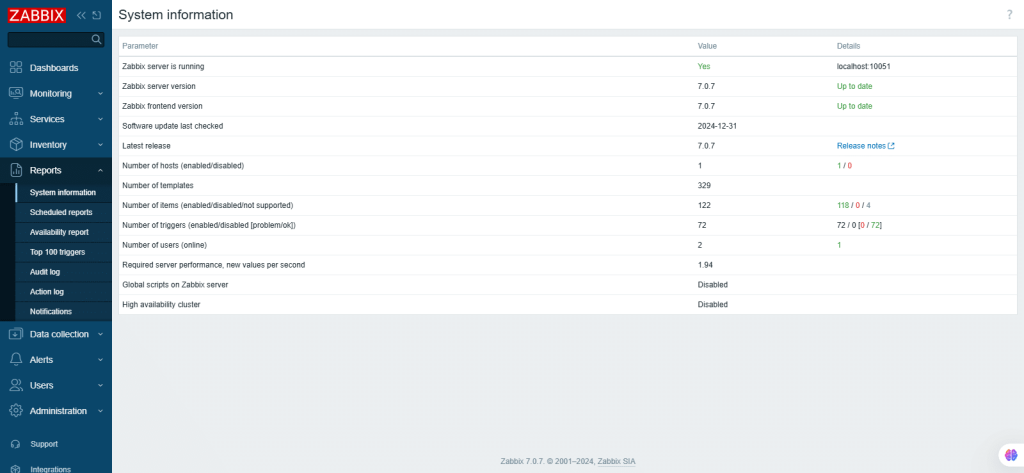
Displaying system information
Here, summary of the key Zabbix server and system data is displayed. The System information can be displayed as a dashboard widget.
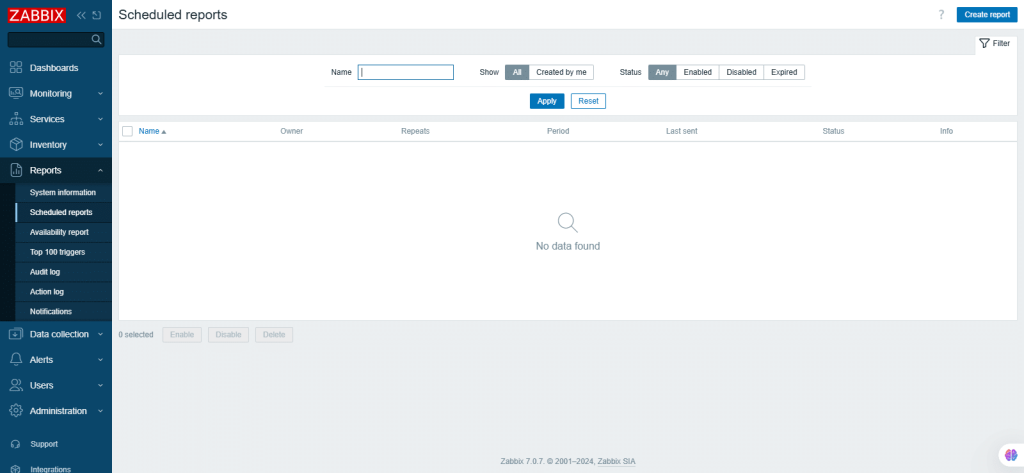
31. Scheduled reports
On the Scheduled Reports page, users with the appropriate permissions can set up scheduled PDF generation of dashboards, which will be emailed to designated recipients.
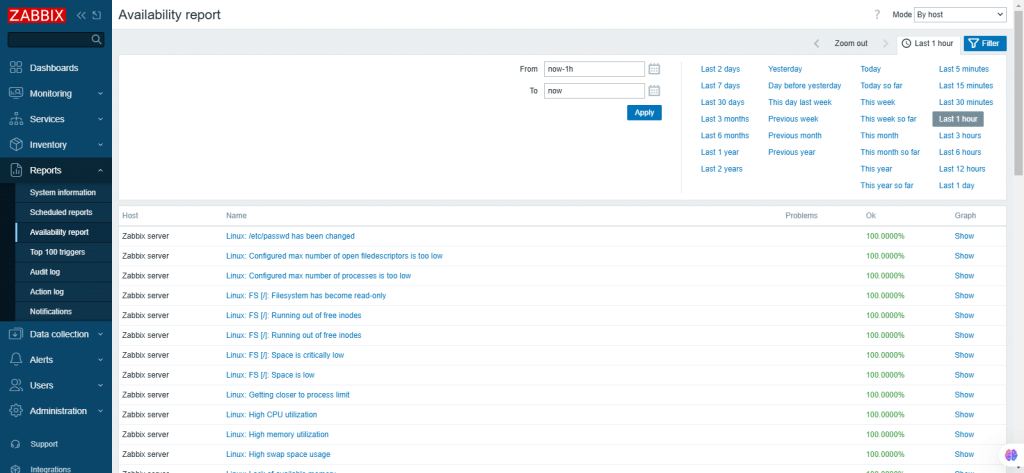
32. Availability report
Here, you can see what amount of time each trigger has been in problem/OK state. The percentage of time for each state is displayed. It is easy to determine the availability situation of various elements on your system.
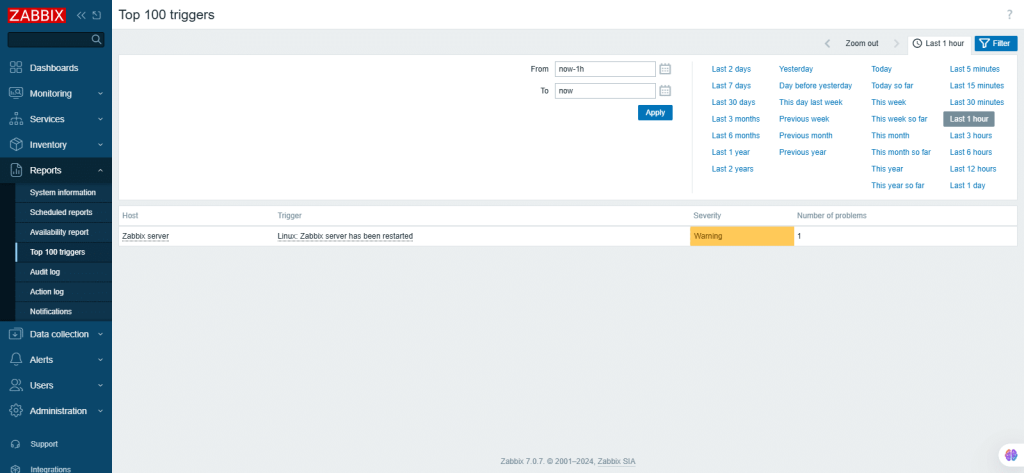
33. Top 100 triggers
In the Top 100 triggers, you can see the triggers with the highest number of problems that are detected during the selected period.
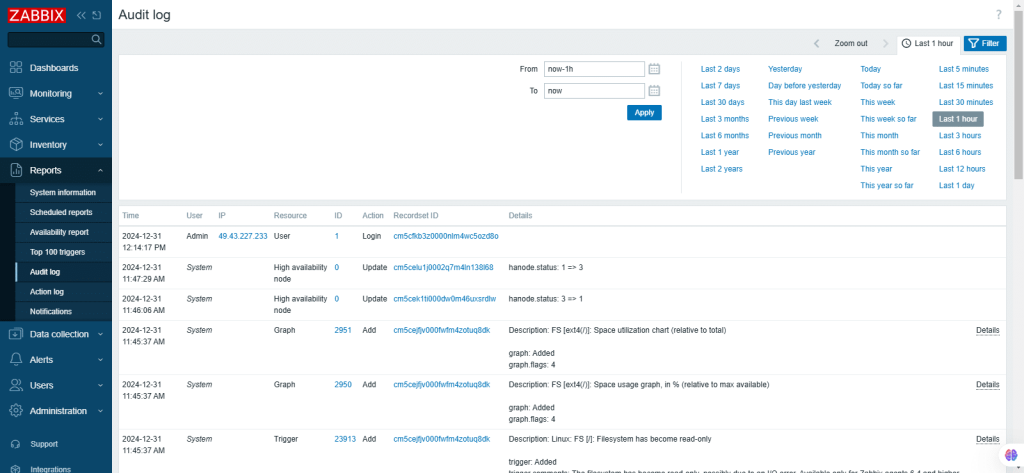
34. Audit log
Here, you can view the records of the user and system activity.
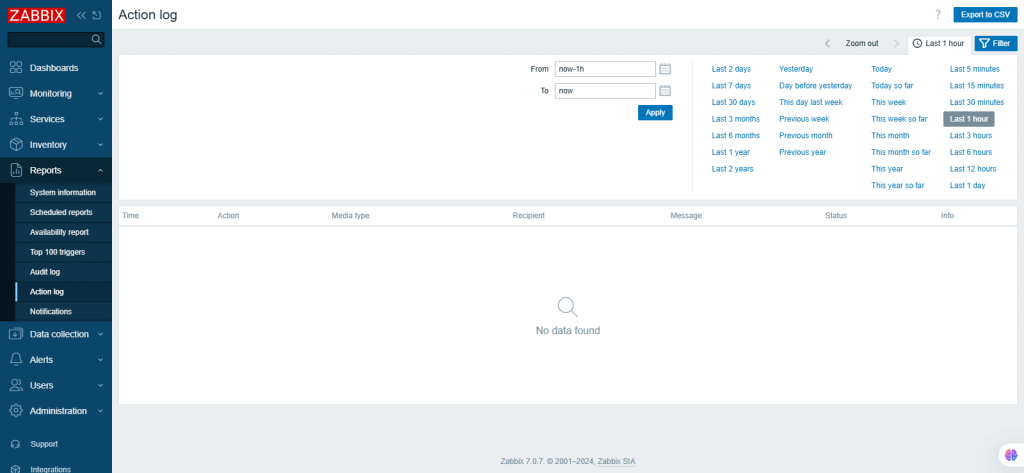
35. Action log
Here, users can view details of the operations like notifications, remote commands executed within an action.
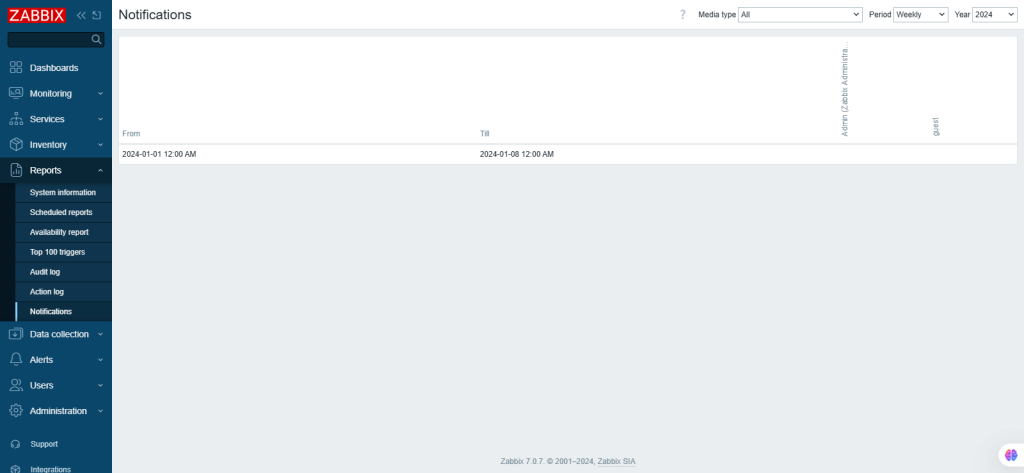
36. Notifications
The Notifications section displays a report on the number of notifications sent to each user.
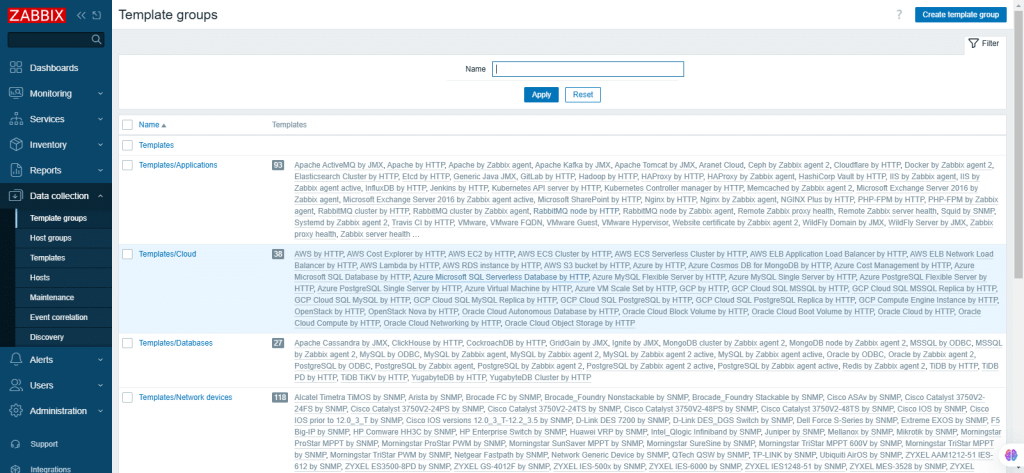
37. From the left-navigation menu, select Data Collection.
Template groups:
Here, existing template groups are displayed. Users can configure and maintain template groups.
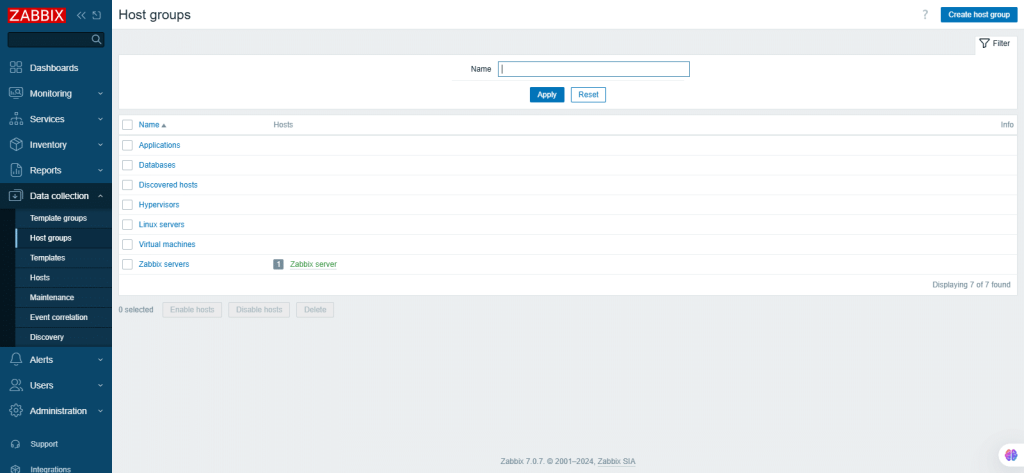
38. Host groups
A list of existing host groups is displayed, and users can configure and maintain host groups.
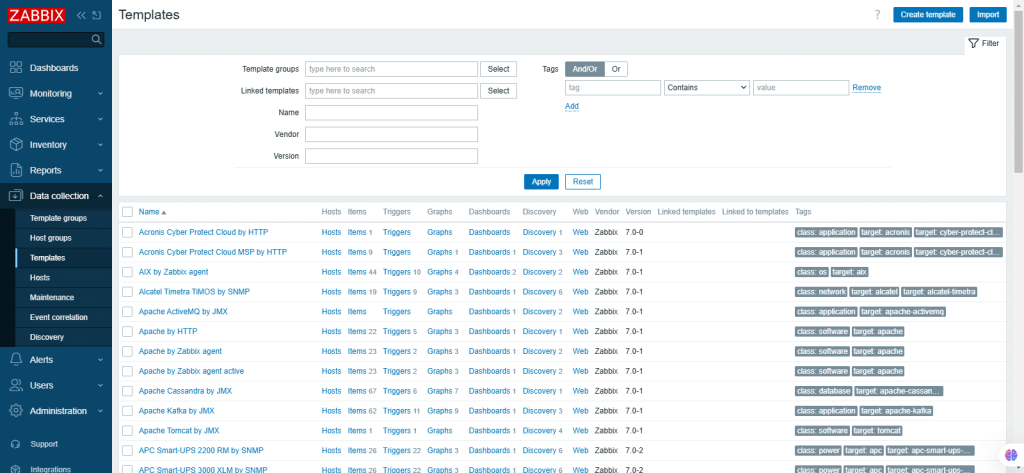
39. Templates
A list of existing templates and their details are displayed. Users can configure and maintain templates.
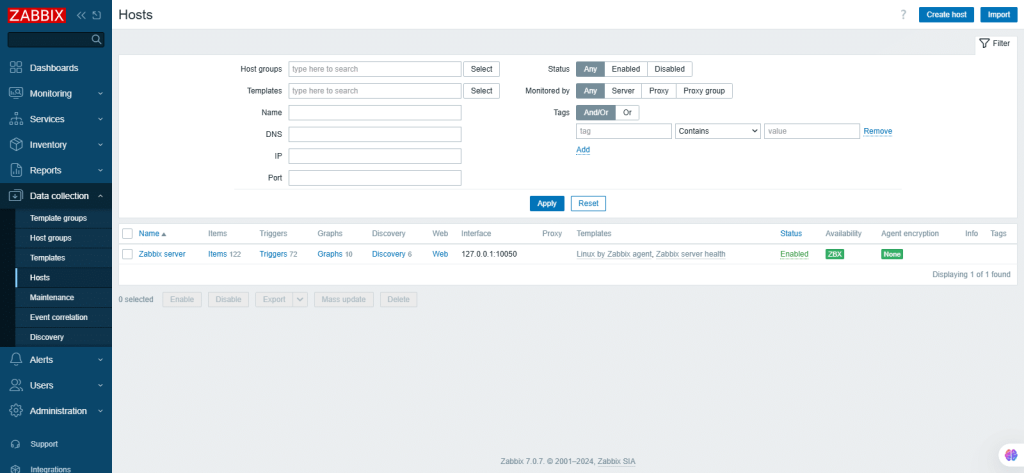
40. Hosts
A list of existing hosts and details are displayed. Users can configure and maintain hosts.
- Create host: to configure a new host.
- Import: To import a host from YAML, XML, or JSON file.
41. Maintenance periods
A list of existing maintenance periods and their details are displayed. Here, users can configure and maintain maintenance periods for hosts.
42. Event correlation
Zabbix users can configure and maintain global correlation rules for Zabbix events.
43. Discovery rules
In this section, users can configure and maintain discovery rules.
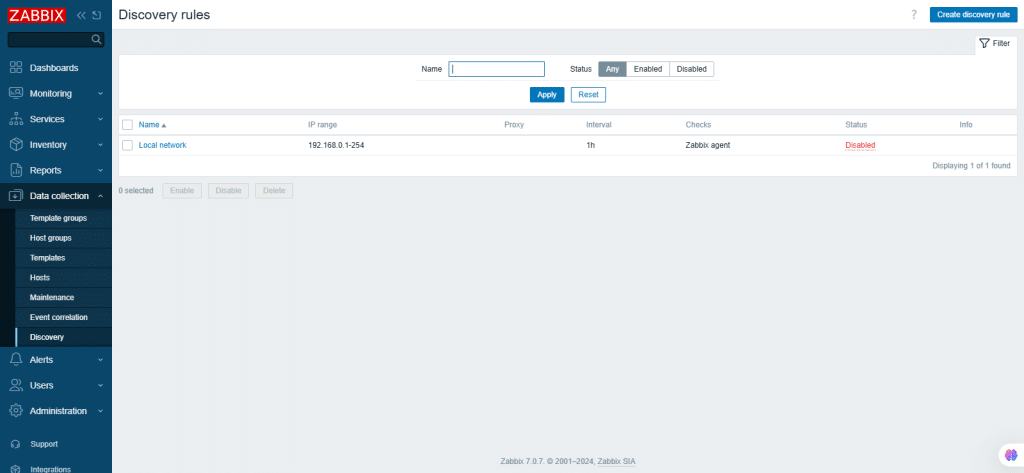
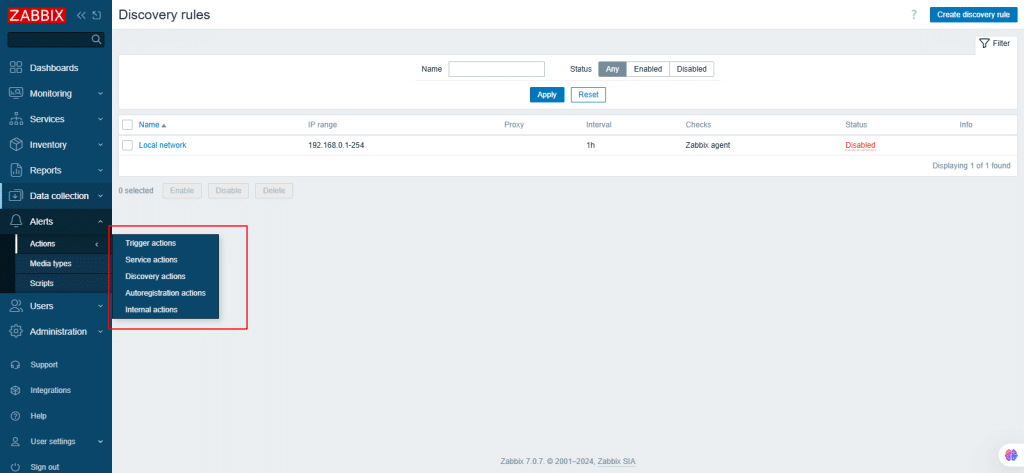
44. From the left navigation menu, select Alerts. This is related to configuring alerts in Zabbix.
Performing actions
The displayed actions are assigned to selected event source.
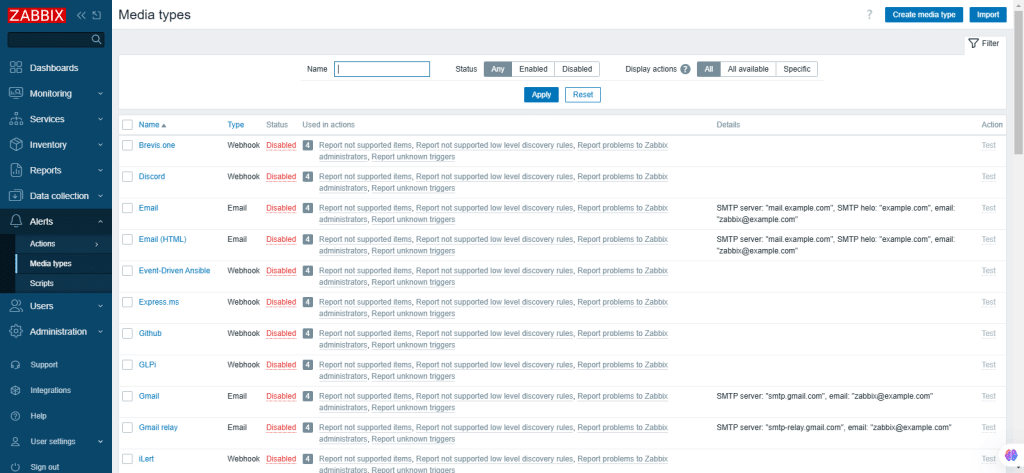
45. Media types
Here, users can configure and manage media type information, which defines how notifications are delivered. Details such as email addresses are stored with individual users. The section displays a list of existing media types and their details.
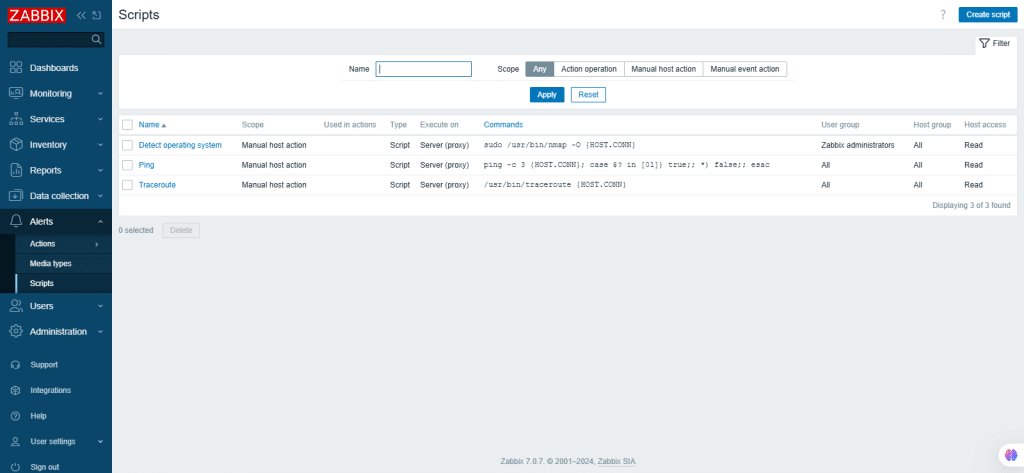
46. Scripts
In this section, users can configure and manage global scripts. Depending on the scope and user permissions, scripts can be executed from various front-end locations such as Dashboard, Problems, Latest Data, Maps. Scripts are executed on the Zabbix agent, Zabbix server that is proxy, or Zabbix server only.
47. From the left-navigation menu, select Users.
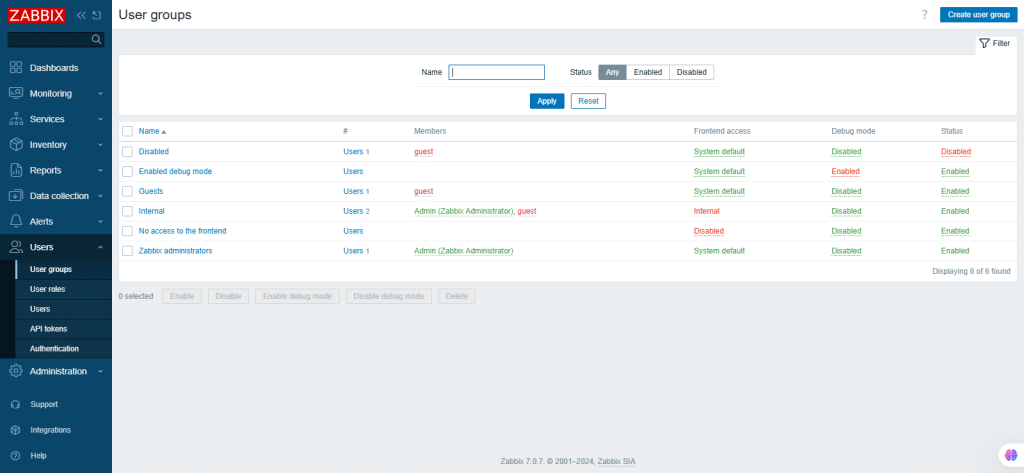
User groups
User groups of the system are maintained, and the list of existing user groups is displayed with their details.
48. User roles
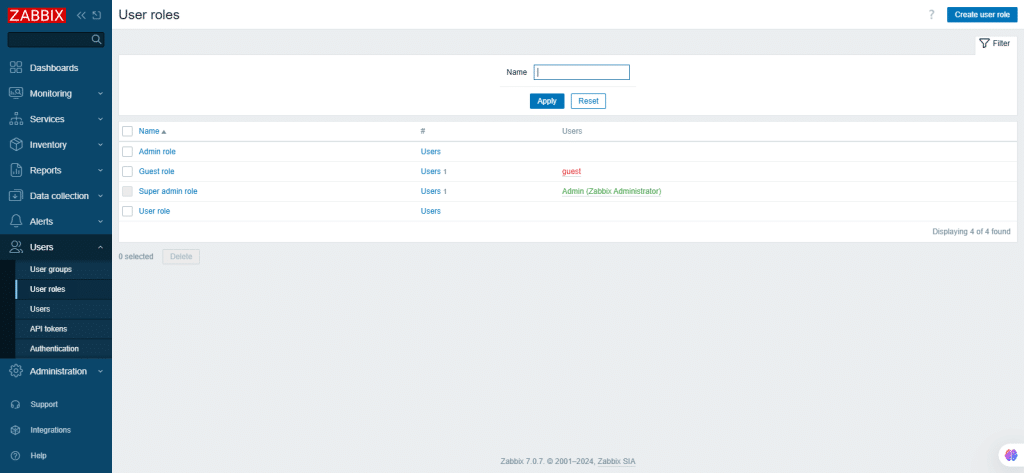
Here, you can create user roles with granular permissions based on the selected user type whether it is User, Admin, or Super Admin).
Permissions are granted by default based on the user type but can only be revoked within the available subset. Unavailable permissions are grayed out and cannot be accessed. User roles can be assigned to system users, with each user having one assigned role.
49. Users
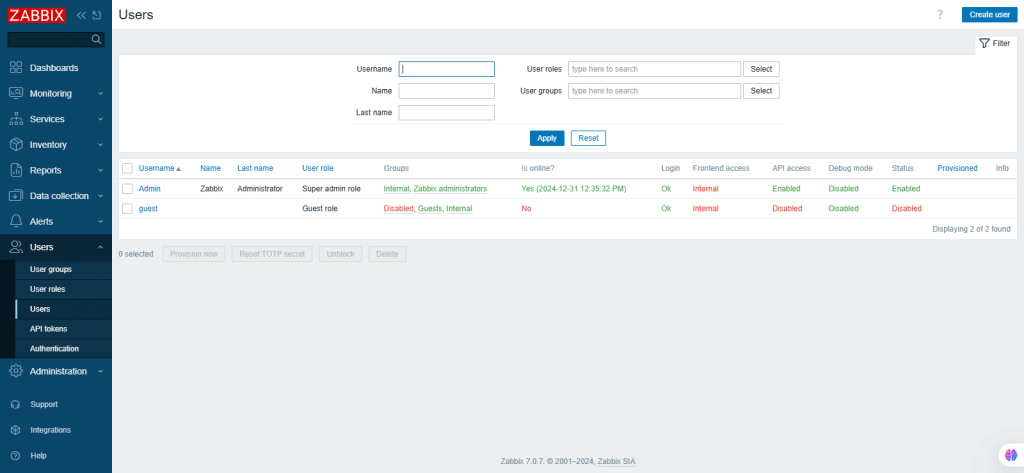
Users of the systems and their details are displayed and maintained.
50. API tokens
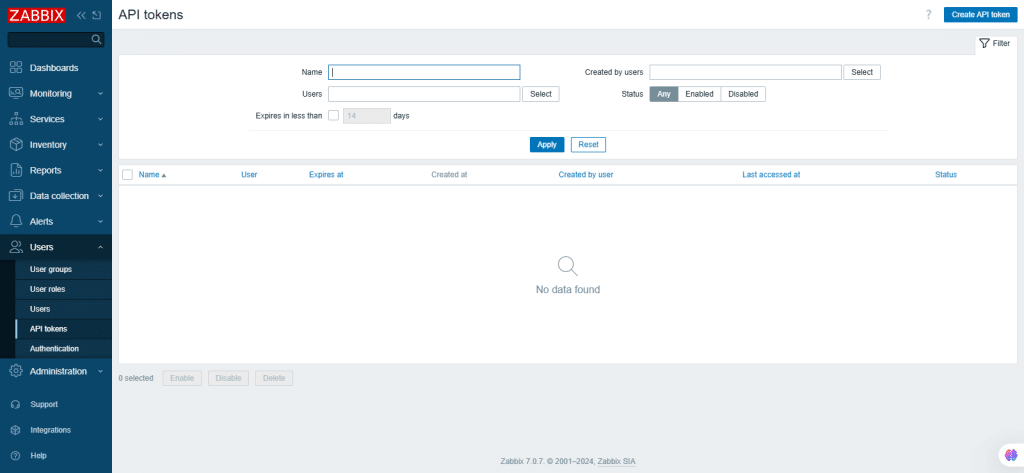
The API tokens section allows you to create and manage API tokens.
You can filter tokens by name, assigned users, expiry date, creator, or status (enabled/disabled). Click on a token’s status to toggle enable/disable a token in the list.
To create a new token, click Create API Token and complete the required fields in the configuration screen.
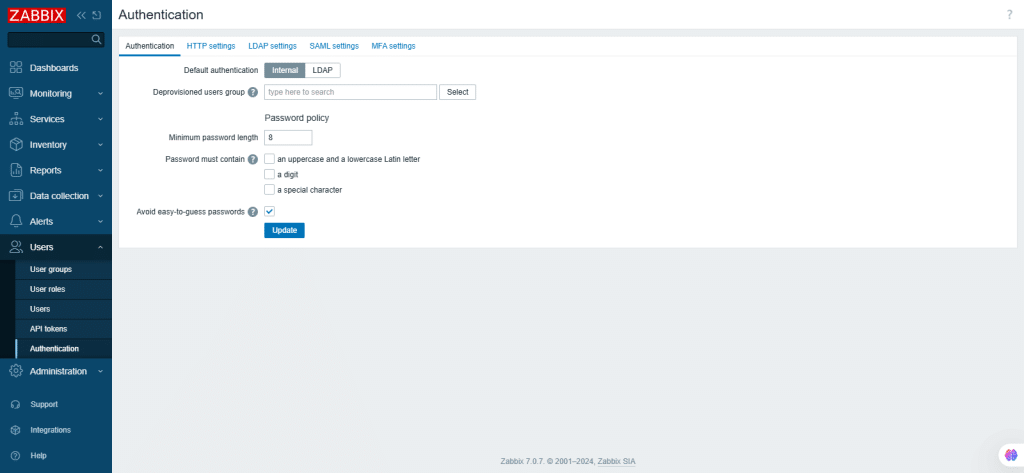
51. Authentication
This section allows you to configure the authentication method for Zabbix and set internal password requirements. Some of the available methods include internal, HTTP, LDAP, SAML, and MFA authentication.
52. Navigate to the left navigation menu and select Administration.
This is available to Super Admin type users only.
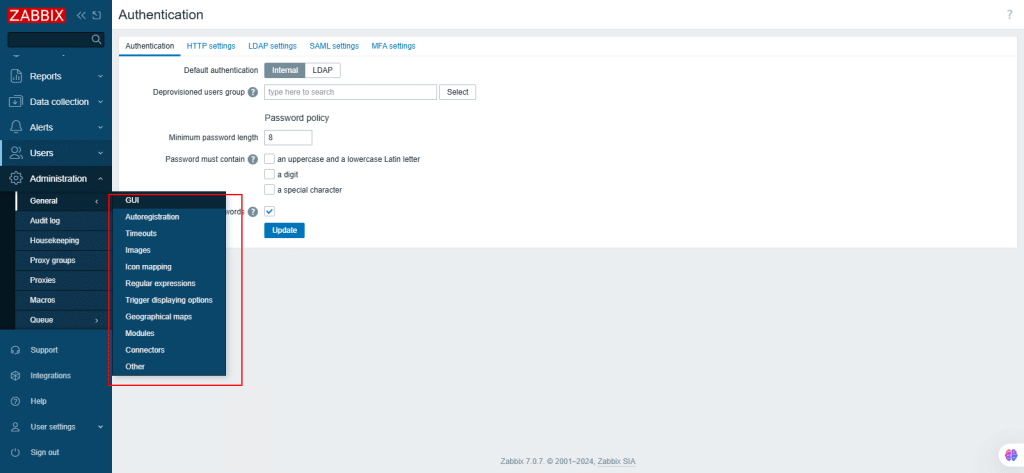
General tips
This is useful for setting front-end related defaults and to customize Zabbix.
- GUI: In this section, you can customize several front-end related defaults.
- Auto registration: Here, you can configure encryption level for active agent.
- Time-outs: You can set global and network time-outs.
- Images: Displays all the images available in Zabbix.
- Icon mapping: Based on inventory field information, you can create icon mappings for hosts. The mappings can be used in network map configuration to automatically assign icons to matching hosts. To create a new map, click Create Icon Map in the top-right corner.
- Regular expressions: You can create custom regular expressions that can be used in different places in the front end.
- Trigger displaying options: Customizes how trigger status is displayed on the front-end.
- Geographical maps: Lets you select and configure the geographical map tile service provider for the Geomap widget.
- Modules: You can administer custom as well as built-in front-end modules.
- Connectors: Enables configuration of connectors for streaming Zabbix data to external systems via HTTP
- Other: Configures other front-end parameters.
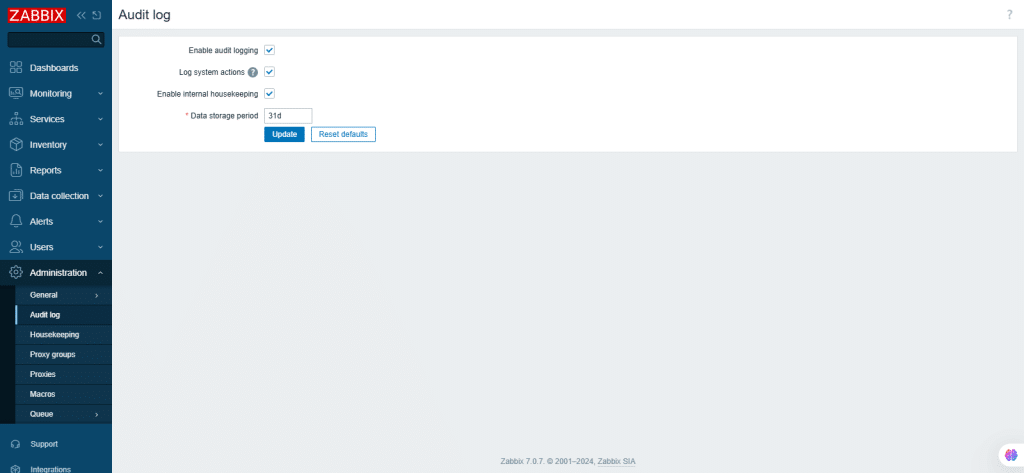
53. Audit log
This section is used to configure audit log settings.
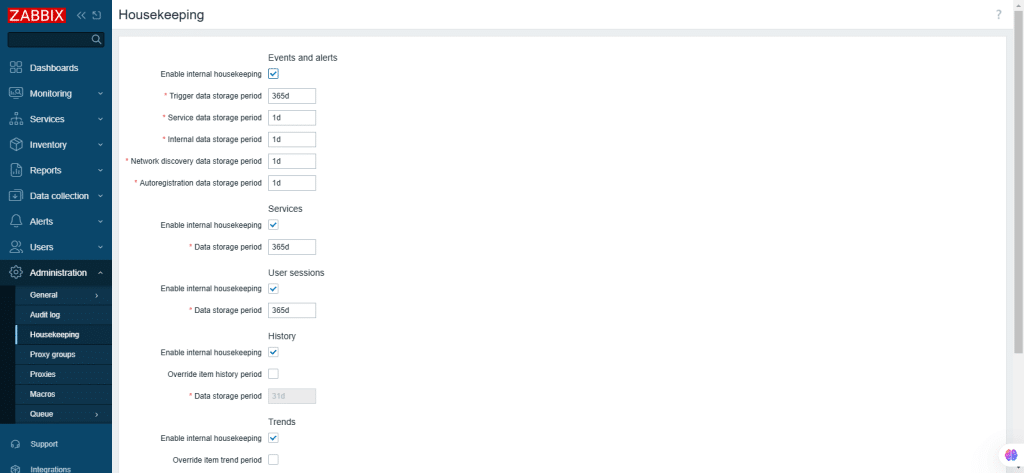
54. Housekeeping
This section is where you can remove outdated information and also houses the information that is deleted by the user.
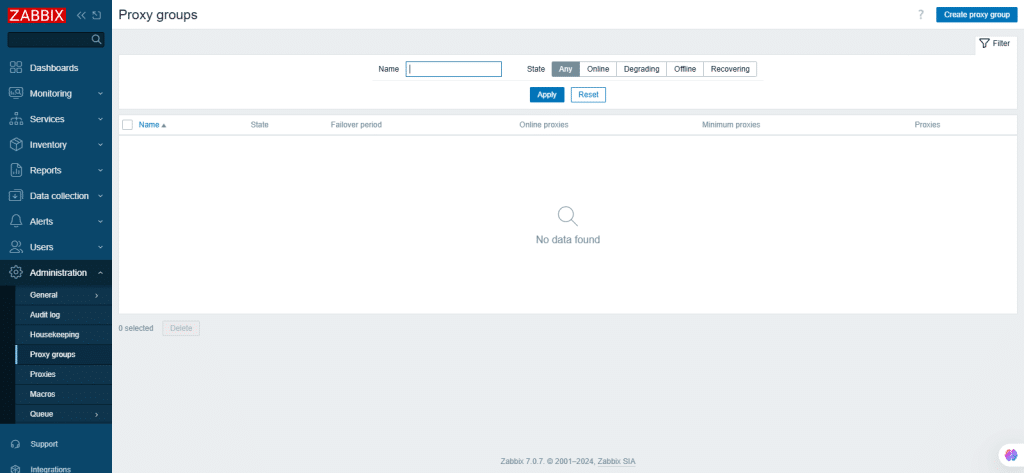
55. Proxy groups
A list of proxy groups and their details are displayed. Proxy groups are used for load balancing, automatically distributing hosts across proxies, and ensuring high availability between them.
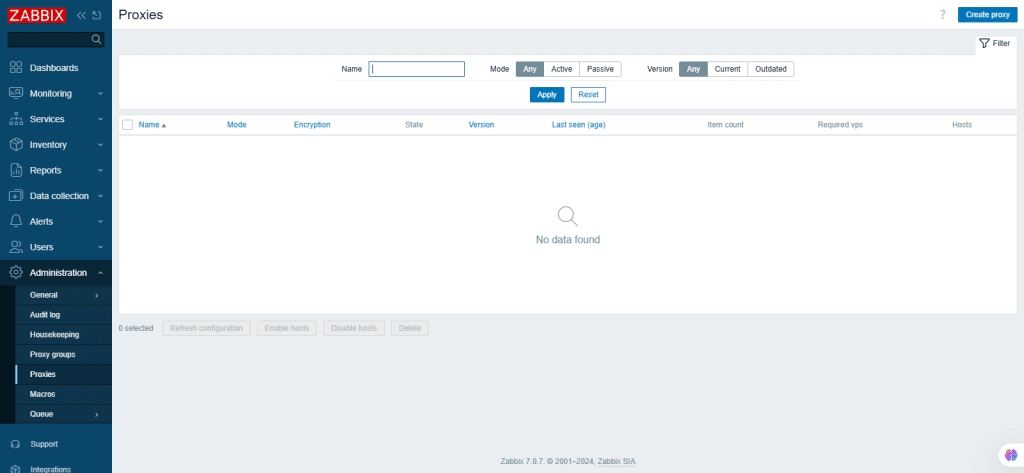
56. Proxies
In this section, proxies for distributed monitoring can be done by in the Zabbix front-end.
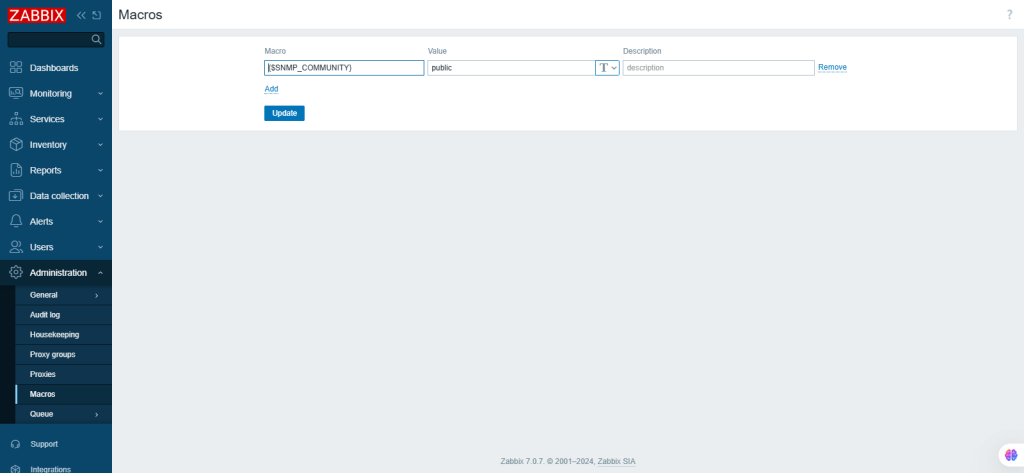
57. Macros
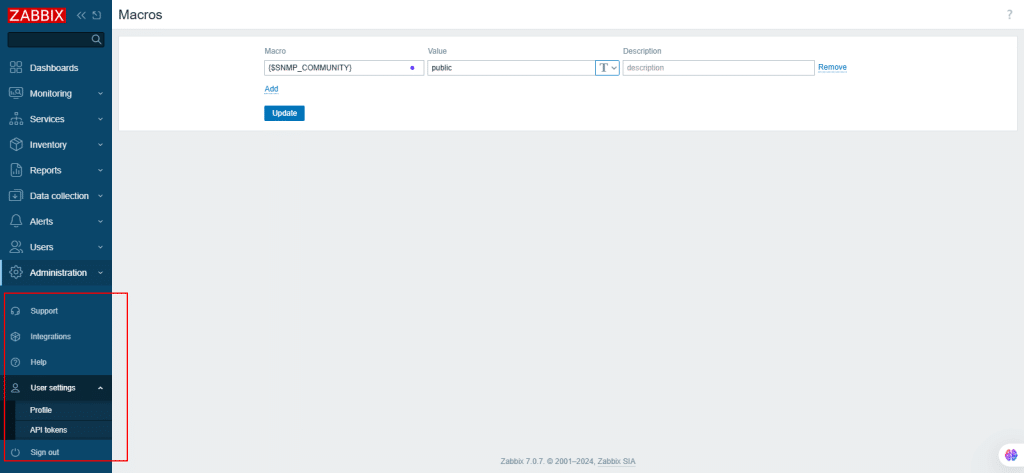
The Macros section allows you to define system-wide user macros as name-value pairs, with values stored as secret text, plain text, or Vault secrets. Descriptions can also be added.
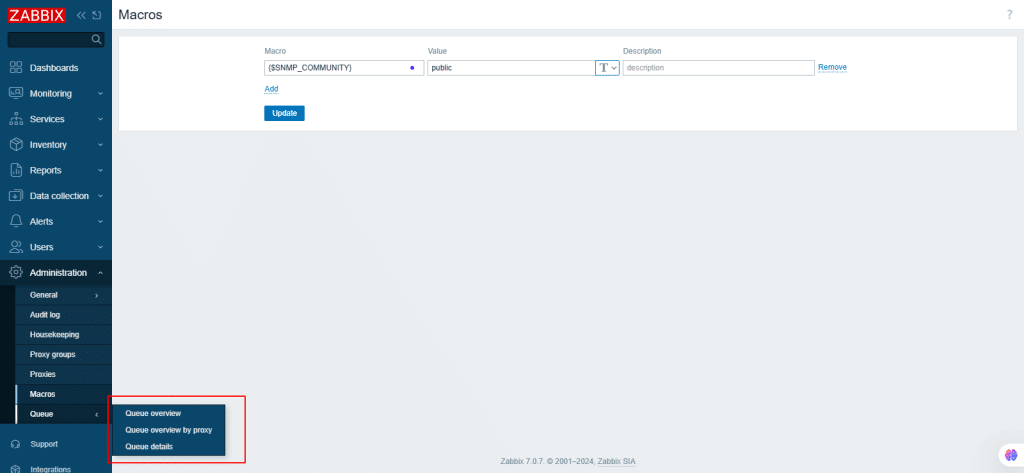
58. Queue
It has items that are waiting to be updated displayed. When there are no items in the queue, it should be green.
59. From the left-navigation menu, select
- User settings: Depending on user role permissions, it contains:
- Profile: Customize Zabbix front-end features.
- API tokens: Manage API tokens assigned to the current user.
- Sign out: Exits from the Zabbix server.
And that’s it! You have successfully set up Zabbix on your Kamatera server.


